Sale!

Market Scanner

Price range: ₹500.00 through ₹3,000.00

πŸ”₯ Specially Designed for Day Traders
πŸ” Scans Up to 40 Symbols Simultaneously
πŸ“ˆ Live Bullish & Bearish Trend Signals
πŸ“Š Real-Time ROC & Open Interest (OI)
⏱️ Catch Recency Signal & Auto-Sorting
🧠 Auto-Filters Old & Expired Signals 

SKU: N/A Category: Brand:

🌟 Core Features

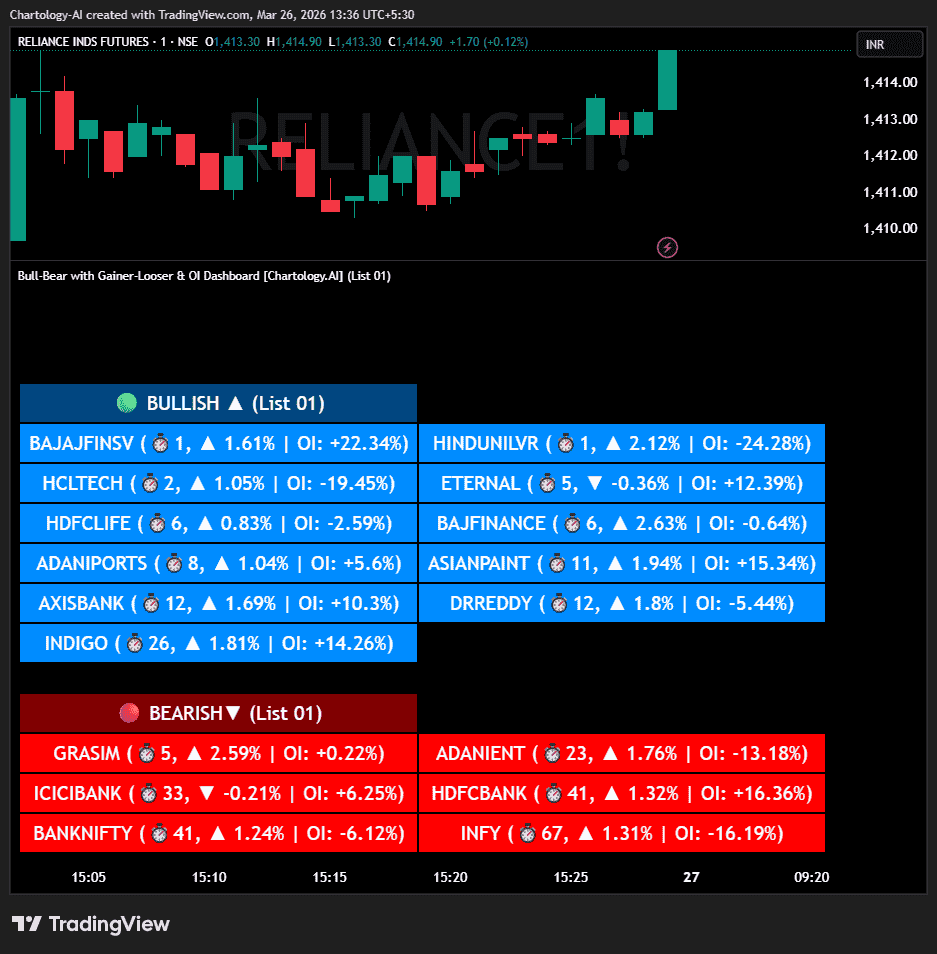
                  • Advanced Trend Detection: The script runs an algorithm silently in the background across up to 40 different assets at once. It categorizes each asset strictly into a 🟒 Bullish or πŸ”΄ Bearish state based on the current timeframe.

                  • Signal Recency Tracker (⏱️): It doesn’t just tell you the trend; it tells you when it happened. The dashboard displays the exact number of bars that have passed since the signal flipped.

                  • Auto-Sorting Algorithm: Using a custom Bubble Sort sequence, the dashboard automatically pushes the freshest signals to the front. A signal that fired 1 bar ago will always appear before a signal that fired 9 bars ago, ensuring you never miss a new breakout.

                  • True Daily Price ROC (%): Calculates the precise percentage change of the current price compared to the previous day’s closing price, giving you a highly accurate view of intraday momentum (β–² or β–Ό).

                  • Automated Open Interest (OI) Fetching: The script dynamically hunts for the _OI counterpart of your selected futures tickers. It calculates the intraday Open Interest % change from the previous day’s close.


βš™οΈ Dashboard & Input Settings

When you open the indicator’s Settings (the gear icon), here is what you can configure:

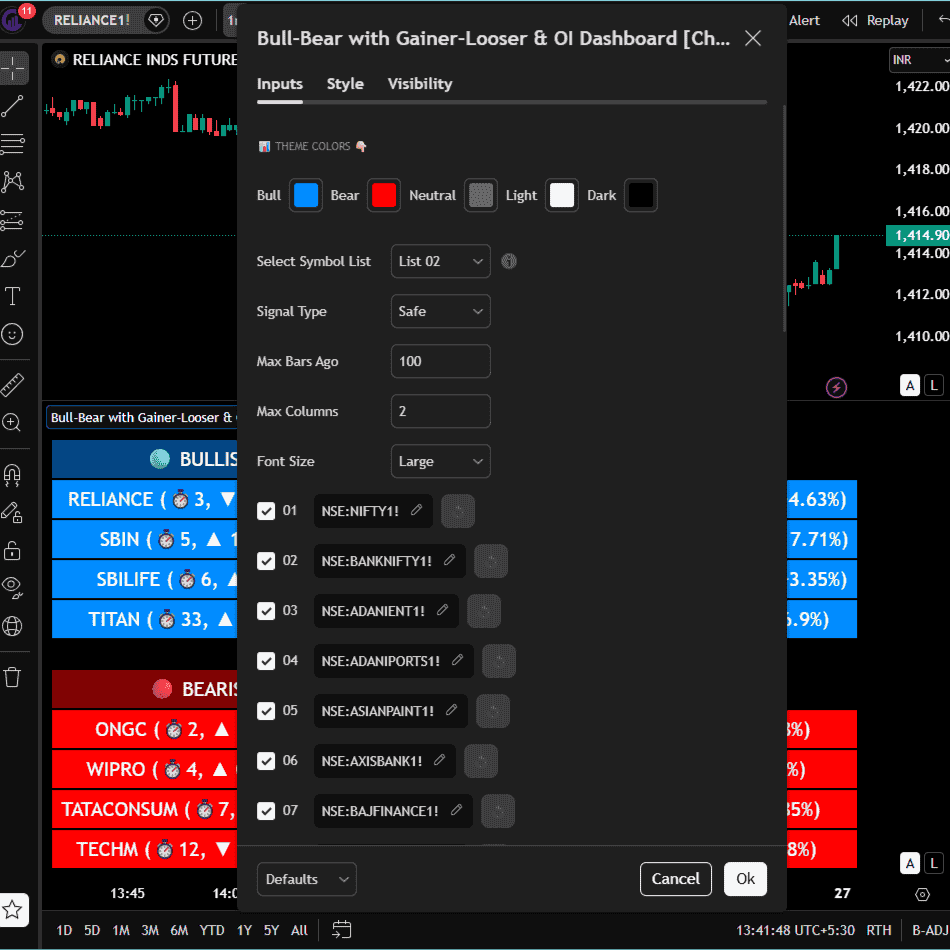
1. Select Symbol List (Dropdown)

                      • What it does: Toggles the dashboard’s focus.

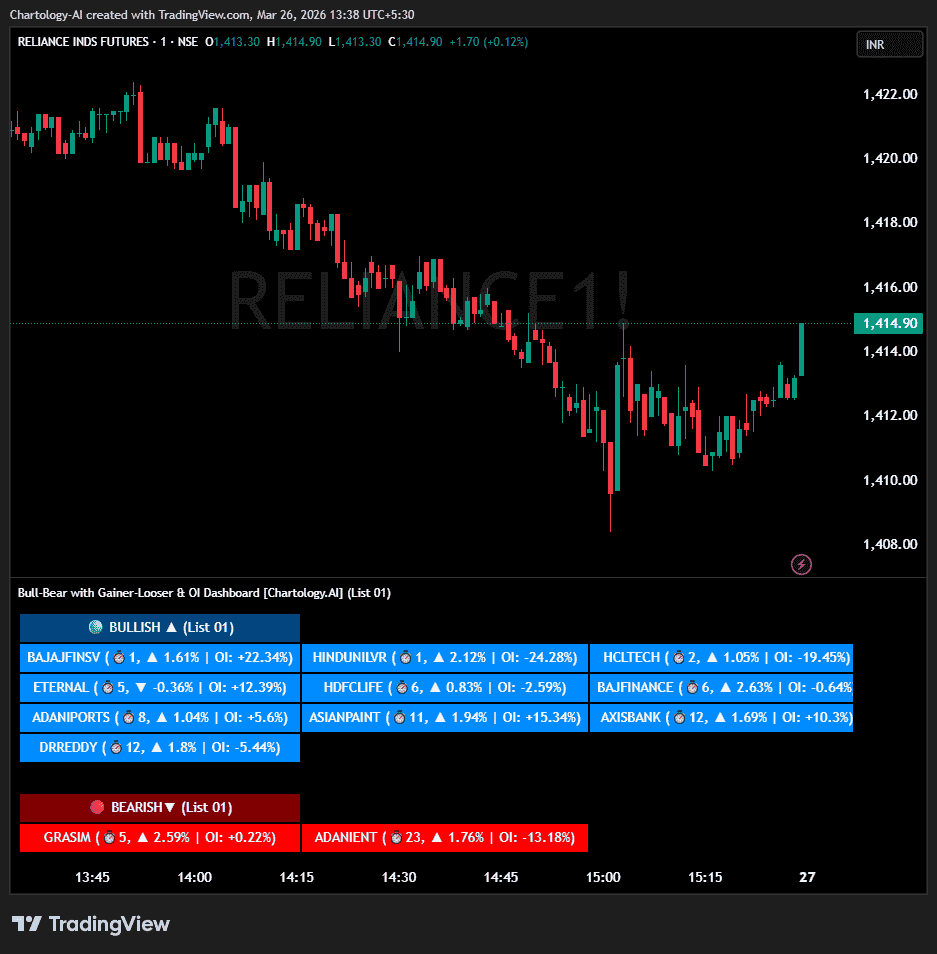
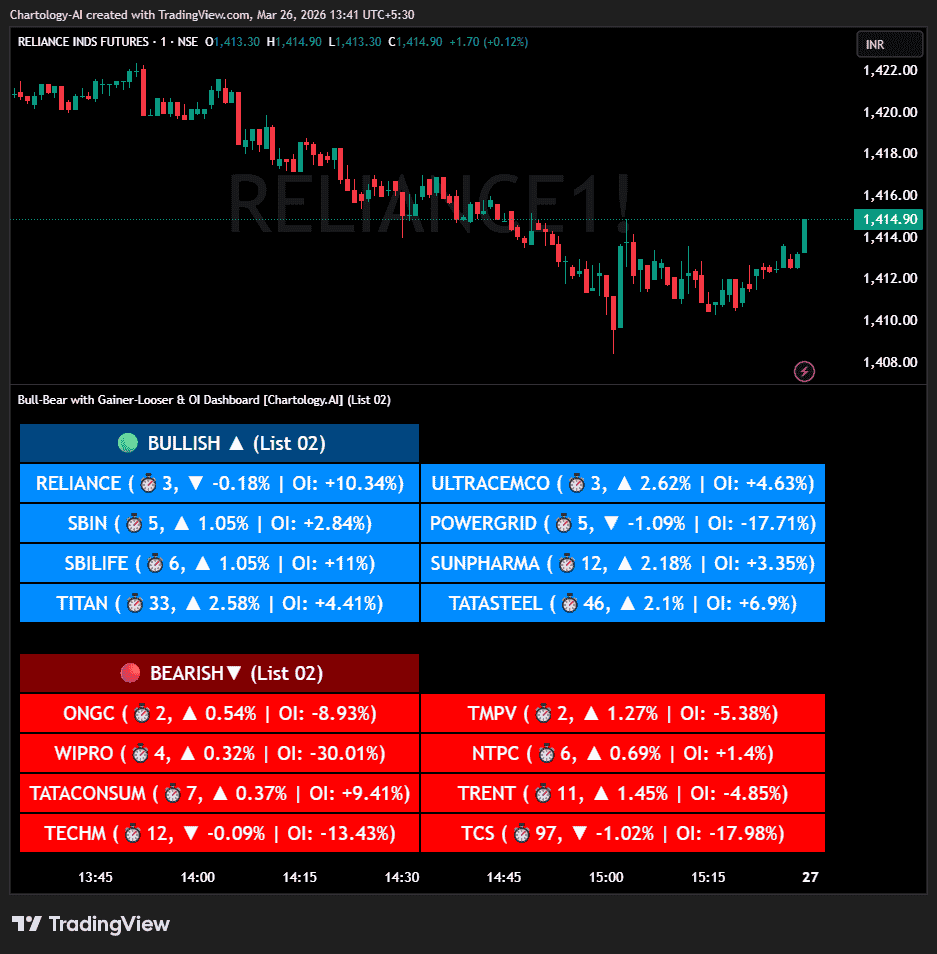
                      • Options: Choose “List 01” to monitor symbols 1 through 20 (e.g., Core Indices, Adani, Banks) or “List 02” to monitor symbols 21 through 40 (e.g., Metals, IT, Pharma).

2. Theme Colors

                      • What it does: Allows you to completely customize the aesthetic of the dashboard to match your chart.

                      • Options: You can independently change the colors for Bull cells, Bear cells, Neutral backgrounds, Light text, and Dark borders.

3. Ticker Customization (01 to 40)

                      • What it does: The ultimate control center for your watchlists.

                      • Options: * Checkbox: Quickly turn a specific stock ON or OFF without deleting the ticker name.

                      • Symbol Input: Click the ticker name (e.g., NSE:NIFTY1!) to swap it out for any other asset you prefer using TradingView’s built-in search.

πŸ“– How to Use and Read the Dashboard

Step 1: Reading a Cell Every active signal populates a cell in your dashboard formatted like this:

RELIANCE (⏱️3, β–² 1.25% | OI: +2.40%)

RELIANCE: The name of the asset.

⏱️3: The signal fired exactly 3 bars ago on your current timeframe.

β–² 1.25%: The price is currently up 1.25% from yesterday's close.

OI: +2.40%: The Open Interest has increased by 2.40% since yesterday's close.

Step 2: Trading the OI Setup (The "Secret Sauce") You can use the combination of Price ROC and OI Change to identify the true market sentiment of the assets on your dashboard:

🟒 Strong Bullish (Long Buildup): Dashboard is Bullish + Price is UP (β–²) + OI is UP (+). New money is entering to push the price higher.

πŸ”΄ Strong Bearish (Short Buildup): Dashboard is Bearish + Price is DOWN (β–Ό) + OI is UP (+). New money is entering to heavily short the asset.

⚠️ Weak Bullish (Short Covering): Dashboard is Bullish + Price is UP (β–²) + OI is DOWN (-). Price is only rising because bears are closing their trades, not because new buyers are stepping in.

⚠️ Weak Bearish (Long Unwinding): Dashboard is Bearish + Price is DOWN (β–Ό) + OI is DOWN (-). Price is dropping because earlier buyers are taking profit and exiting.

πŸ“Š Healthy Trading Tips

              • Risk Small:Β Never risk more than 1–2% per trade.
              • Size Smart:Β Adjust position size to volatility and account size.
              • Diversify:Β Don’t put all money in one asset/sector.
              • Plan Ahead:Β Set entry, exit, and stop‑loss before trading.
              • Trade Less:Β Focus on quality setups, avoid overtrading.
              • Use Both Analyses:Β Combine technical charts with fundamental news/events.
              • Control Emotions:Β Stick to strategy, avoid fear/greed.
              • Journal Trades:Β Record reasons, outcomes, and lessons.
              • Stay Informed:Β Track economic calendars and global events.
              • Take Breaks:Β Step away after wins/losses to reset.

🎯 Advanced Discipline

              • Partial Exit:Β Book profits in stages (e.g., 50% at 1:1, 50% at Final Level).
              • Check News:Β Avoid trading during major announcements.
              • No Tweaks:Β Don’t change plan mid‑trade; wait for SL/TP.
              • Fixed Rules:Β Trade with fixed risk, fixed gains.
              • No Averaging Losses:Β Close bad trades, don’t add more.
              • Keep Learning:Β Evolve strategy with market changes.
              • Believe:Β Trust your plan and process.
              • Backtest:Β Practice setups until they’re second nature.
              • Daily Routine:Β Pre‑market Preparation, post‑market review.
              • Optimize Setup:Β Clean workspace, fast platform, no distractions.
              • Track Metrics:Β Win rate, average reward, expectancy, time of day, setup performance.
              • Trader Identity:Β Follow rules; money is a byproduct.
              • Liquidity Check:Β Avoid low‑volume instruments.
              • Respect Trend:Β Trade with momentum, not against it.
              • Avoid Over‑Leverage:Β Keep leverage low, avoid margin unless planned.

This content, including any tools, software, datafeeds, indicators, or scanners, is provided strictly for charting, educational, informational, and paper‑trading purposes only. It does not constitute investment advice, buy/sell recommendations, or real‑money trading strategies.

              • Not Advisors:Β We are not registered as investment advisors or research analysts.
              • Charting Only:Β Use is limited to testing strategies and evaluation; any application to real trading is at the user’s sole risk.
              • No Liability:Β No liability is accepted for financial loss, trading loss, or damages arising from use of the tools or data.
              • Data Limitations:Β Market data may be delayed, inaccurate, or incomplete. Past or hypothetical performance is not indicative of future results.
              • Signals Disclaimer:Β Automated signals are for evaluation only and should not be treated as accurate or real trading instructions.
              • High Risk:Β Trading and investing involve substantial risk and can result in losses beyond the initial capital.
              • Independent Judgment:Β Users must exercise independent judgment and consult licensed professionals before making financial decisions

⚠️ Final Note: Trading is speculative and may not be suitable for all investors. Use only risk capital and never invest money you cannot afford to lose.

βœ… Always remember🧠 my 3R RuleπŸ’‘: If the moneyπŸ’° is yours then, RISKβš–οΈ, REWARDπŸ† and REGRETπŸ˜” are solely yours. πŸ”₯

Scroll to Top

TradingView Strategy Access Form

Schedule Appointment

Fill out the form below, and we will be in touch shortly.