๐ Features One by One (With Section Breakdown)
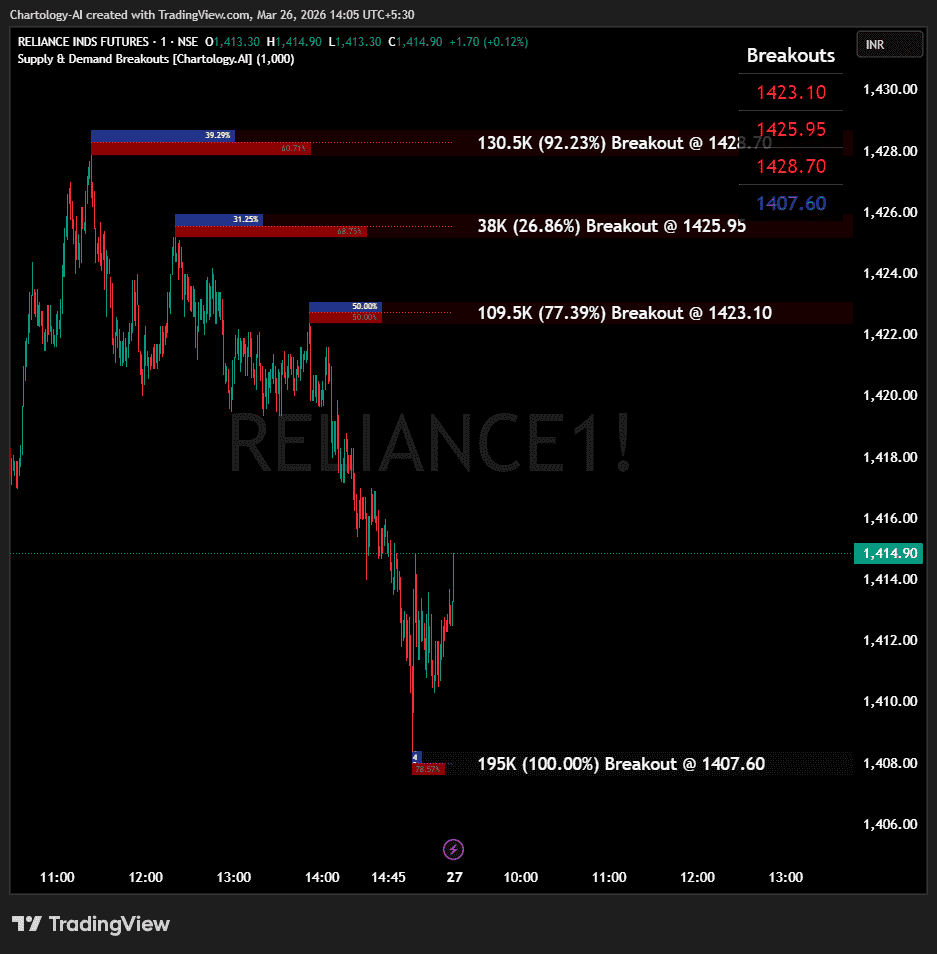
1. Smart Supply & Demand Zones (Section 3 & 6) The script doesn’t just draw random support and resistance lines; it uses Pivot Highs and Pivot Lows to identify true swing points.
Supply Zones (Red): Formed at Pivot Highs. These represent areas where sellers overwhelmed buyers.
Demand Zones (Blue): Formed at Pivot Lows. These represent areas where buyers overwhelmed sellers.
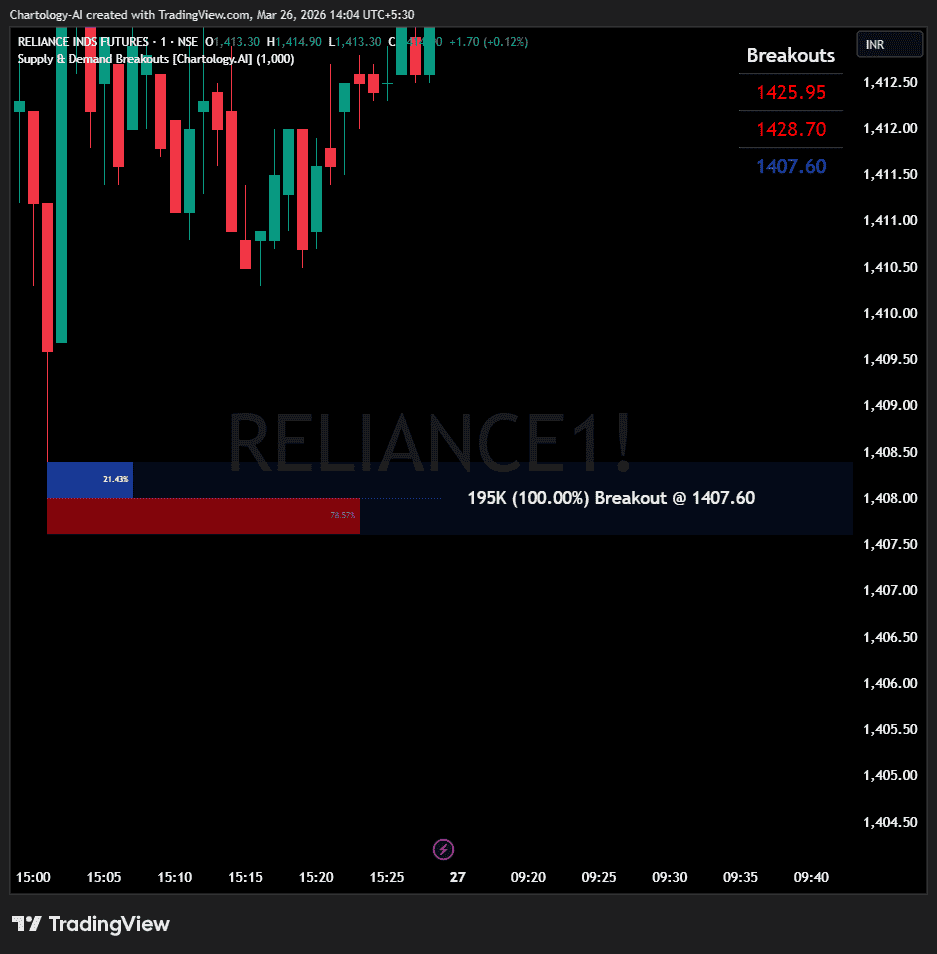
2. Deep Volumetric Analysis (Section 6) Instead of just drawing a box, the script analyzes the actual candle that created the zone to determine how strong the reversal was. It splits the zone into two internal boxes showing Buy Volume % vs Sell Volume %.
Simple: Based purely on where the candle closed within its high-low range.
Hybrid: Gives extra weight to the physical body of the candle (committed volume) over the wicks.
Delta: Measures the directional delta of the body relative to the entire range.
3. The “Specific Section” Explained: Zone History & State Management (Section 5) This is the most powerful part of the code (method Trace_History). It gives each zone a “memory”:
Fresh: The zone is drawn brightly and extended to the right.
Tested (Touched): If price comes back and dips into the zone, the script instantly changes the zone’s opacity (makes it dimmer) and triggers a “Touch” alert. It remembers that this zone is no longer fresh.
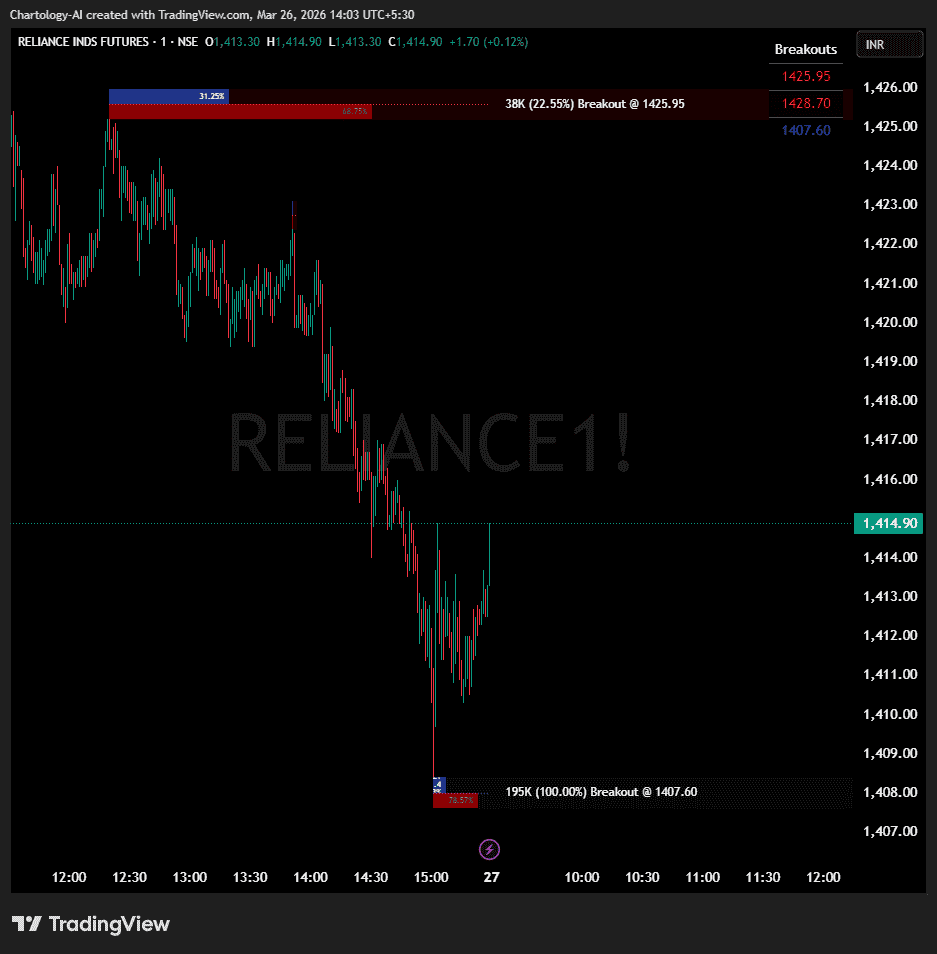
Broken (Invalidated): If the price completely breaks and closes through the back of the zone, the script realizes the zone has failed. It triggers a “Breakout” alert, removes the zone from the active list, and either stops drawing it or deletes it entirely to keep your chart clean.
4. Breakout Dashboard (Section 7) A live table on your chart that constantly updates with the exact price coordinates of the active Supply and Demand zones, so you know exactly where the breakout levels are without having to scroll back through the chart.
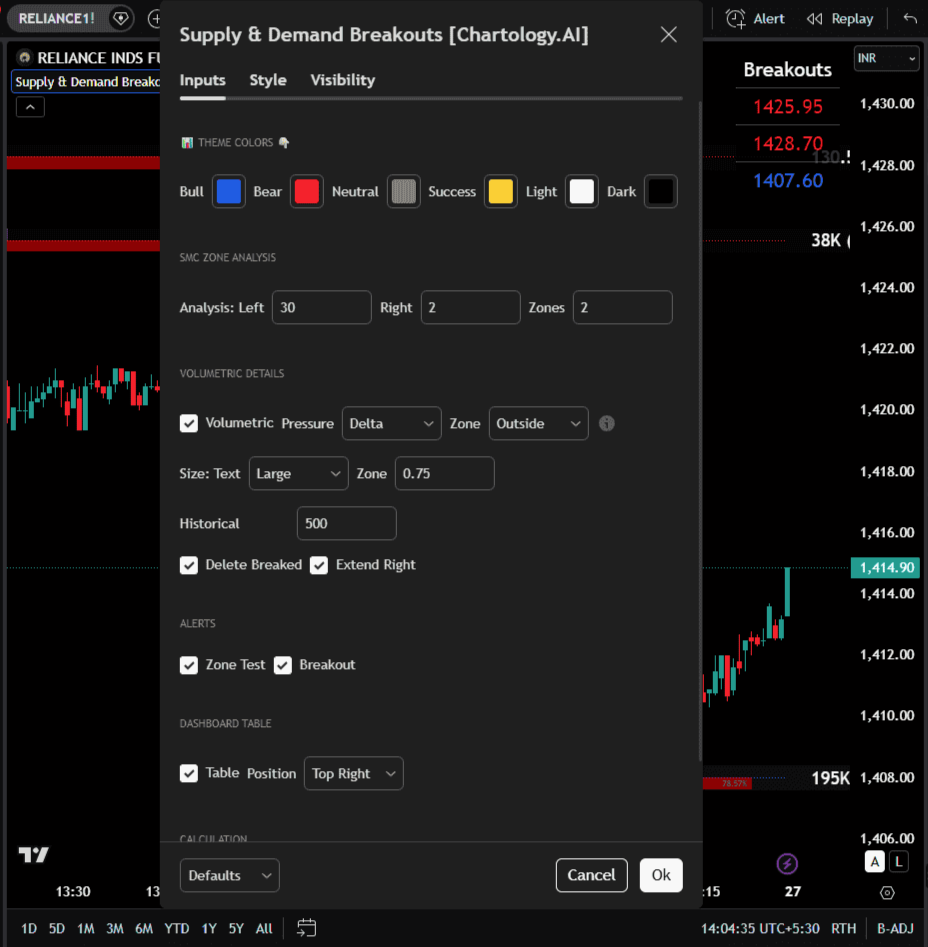
โ๏ธ Inputs & Settings
When you apply this to your chart and open the settings (gear icon), here is what you can control:
1. Theme Colors
Customize the colors of the Bull (Demand) and Bear (Supply) zones, as well as the text and background colors of the dashboard table to match your chart’s dark or light mode.
2. SMC Zone Analysis (Hidden by default, used for logic)
Analysis Left/Right Bars: Dictates how many bars must pass to confirm a Pivot. (Default is 30 left, 2 right). Higher numbers mean major, macro zones. Lower numbers mean minor, scalp zones.
Max Zones: Limits how many active zones are displayed on the screen at once to prevent chart clutter.
3. Volumetric Details
Volumetric (Toggle): Turn the internal buy/sell percentage boxes on or off.
Pressure: Choose your volume algorithm (Simple, Hybrid, Delta).
Zone Type (Inside/Outside): Determines how the box is drawn. “Outside” draws the Supply zone above the pivot high, while “Inside” draws it below the pivot high into the candle body.
Delete Breaked: If checked, once a zone is broken by price, it is completely erased from the chart to keep things clean.
4. Alerts
Zone Test: Fires an alert the exact moment the price touches a zone.
Breakout: Fires an alert the exact moment the price breaks entirely through a zone.
๐How to Use This in Your Trading
Here is how a day trader or swing trader would practically use this indicator:
Step 1: Wait for Zone Creation Let the indicator automatically plot the blue (Demand) and red (Supply) zones. Look at the volumetric numbers inside them. A Demand zone with 85% Buy Volume is a much stronger level than one with 55% Buy Volume.
Step 2: Play the Bounce (Reversal) When price returns to a fresh zone, the indicator will dim the box and fire a "Zone Test" alert. This is your cue to look for a reversal entry (e.g., buying at Demand, shorting at Supply). Place your Stop Loss just outside the back edge of the box.
Step 3: Play the Breakout If the price doesn't bounce but instead slices straight through the zone, the indicator will fire a "Breakout" alert. This tells you the zone has failed, and the momentum is strong in that direction. You can use this to catch breakout trades or flip your bias.
Step 4: Use the Dashboard for Targets Look at the table on your screen. If you are in a Long trade, look at the "Breakouts" column for the nearest Supply (Red) level. That exact price is your Take Profit (TP) target.
๐ Healthy Trading Tips
-
-
-
-
-
-
- Risk Small:ย Never risk more than 1โ2% per trade.
- Size Smart:ย Adjust position size to volatility and account size.
- Diversify:ย Donโt put all money in one asset/sector.
- Plan Ahead:ย Set entry, exit, and stopโloss before trading.
- Trade Less:ย Focus on quality setups, avoid overtrading.
- Use Both Analyses:ย Combine technical charts with fundamental news/events.
- Control Emotions:ย Stick to strategy, avoid fear/greed.
- Journal Trades:ย Record reasons, outcomes, and lessons.
- Stay Informed:ย Track economic calendars and global events.
- Take Breaks:ย Step away after wins/losses to reset.
๐ฏ Advanced Discipline
-
-
-
-
-
-
- Partial Exit:ย Book profits in stages (e.g., 50% at 1:1, 50% at Final Level).
- Check News:ย Avoid trading during major announcements.
- No Tweaks:ย Donโt change plan midโtrade; wait for SL/TP.
- Fixed Rules:ย Trade with fixed risk, fixed gains.
- No Averaging Losses:ย Close bad trades, donโt add more.
- Keep Learning:ย Evolve strategy with market changes.
- Believe:ย Trust your plan and process.
- Backtest:ย Practice setups until theyโre second nature.
- Daily Routine:ย Preโmarket Preparation, postโmarket review.
- Optimize Setup:ย Clean workspace, fast platform, no distractions.
- Track Metrics:ย Win rate, average reward, expectancy, time of day, setup performance.
- Trader Identity:ย Follow rules; money is a byproduct.
- Liquidity Check:ย Avoid lowโvolume instruments.
- Respect Trend:ย Trade with momentum, not against it.
- Avoid OverโLeverage:ย Keep leverage low, avoid margin unless planned.
This content, including any tools, software, datafeeds, indicators, or scanners, is provided strictly for charting, educational, informational, and paperโtrading purposes only. It does not constitute investment advice, buy/sell recommendations, or realโmoney trading strategies.
-
-
-
-
-
-
- Not Advisors:ย We are not registered as investment advisors or research analysts.
- Charting Only:ย Use is limited to testing strategies and evaluation; any application to real trading is at the userโs sole risk.
- No Liability:ย No liability is accepted for financial loss, trading loss, or damages arising from use of the tools or data.
- Data Limitations:ย Market data may be delayed, inaccurate, or incomplete. Past or hypothetical performance is not indicative of future results.
- Signals Disclaimer:ย Automated signals are for evaluation only and should not be treated as accurate or real trading instructions.
- High Risk:ย Trading and investing involve substantial risk and can result in losses beyond the initial capital.
- Independent Judgment:ย Users must exercise independent judgment and consult licensed professionals before making financial decisions
โ ๏ธ Final Note:ย Trading is speculative and may not be suitable for all investors. Use only risk capital and never invest money you cannot afford to lose.
โ
Always remember๐ง my 3R Rule๐ก: If the money๐ฐ is yours then, RISKโ๏ธ, REWARD๐ and REGRET๐ are solely yours. ๐ฅ